https://yougov.co.uk/refer/HdvYK1txkm0PfdJX43_Iow/ <<< follow the link if you would like to join the YOUGOV panel and have your opinions heard
The results of Britain's biggest ever post-election survey reveal the nation's changing political character
Apart from the obvious—joy for the Tories and SNP, gloom for Labour and the Lib Dems, frustration for Ukip—what really happened on 7th May? YouGov has done Britain’s biggest ever post-election survey. We have questioned 100,000 people, weighting the data to match both the British electorate and the results of the 2015 general election.
The graphics show our main findings. Readers can draw their own conclusions. Here are mine:
CULTURE, NOT CLASS
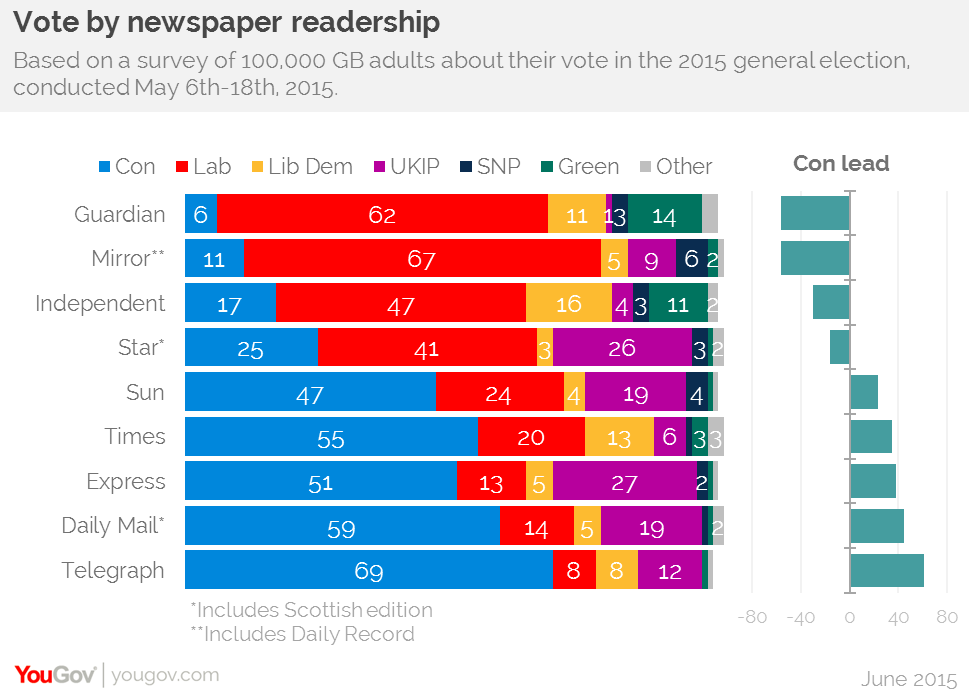
The biggest divides these days are cultural rather than those of class. This is clear not just from the rise of Ukip and the SNP, but from the 40 separate groups we have analysed. The four most Conservative groups are Telegraph, Mail, Express and Times readers; the three least conservative groups are Guardian, Mirror and Independent readers. Newspaper readership provides a far better predictor of Labour and Tory support than any other indicator.
WOMEN FOR LABOUR
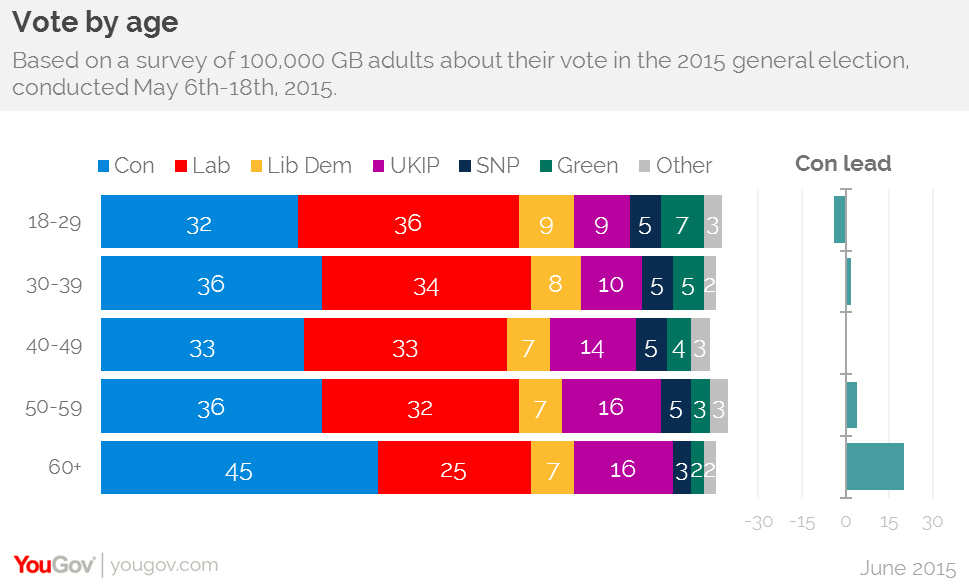
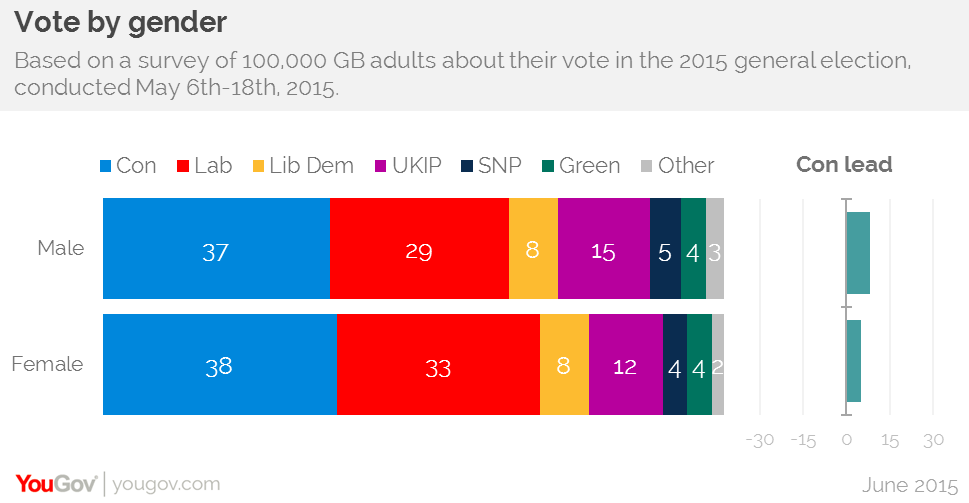
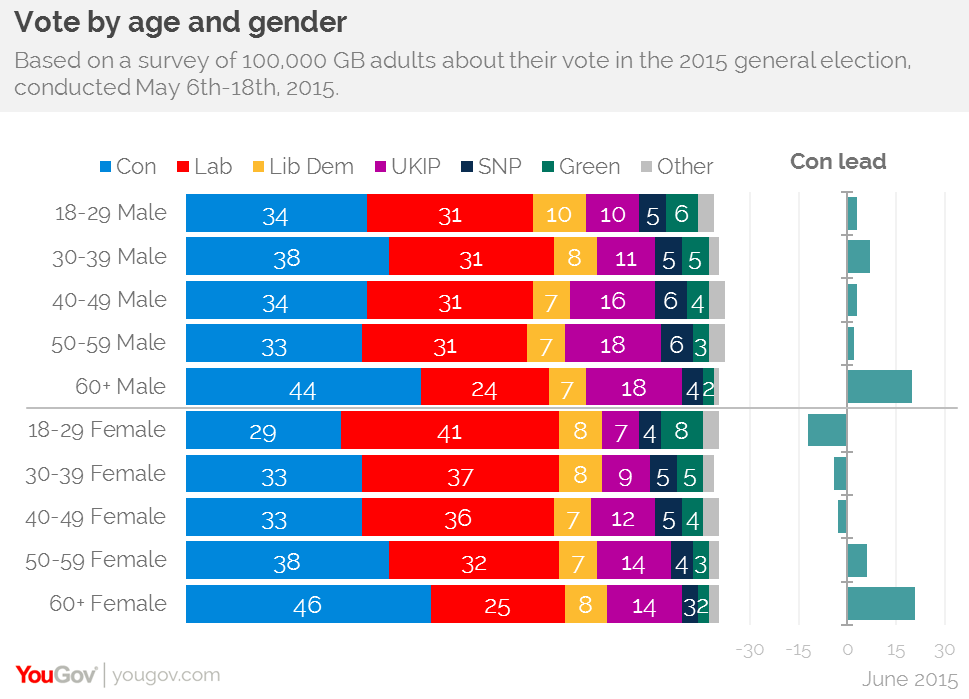
Nowadays, women are more likely than men to vote Labour. It used to be the other way round. For most of the post-1945 era, women tended to be more Tory than men. Detailed analysis from our post-election survey shows that something else is going on. Labour’s advantage is specifically among women under 50. Labour enjoyed a six-point lead among them—while the Tories led by five points among men under 50. Among people over 50, the Tories have a clear lead among both men (by 12 points) and women (by 15 points). In essence, among people born before the mid-1960s, the traditional gender gap persists, while among women born since then, the new gender gap takes over.
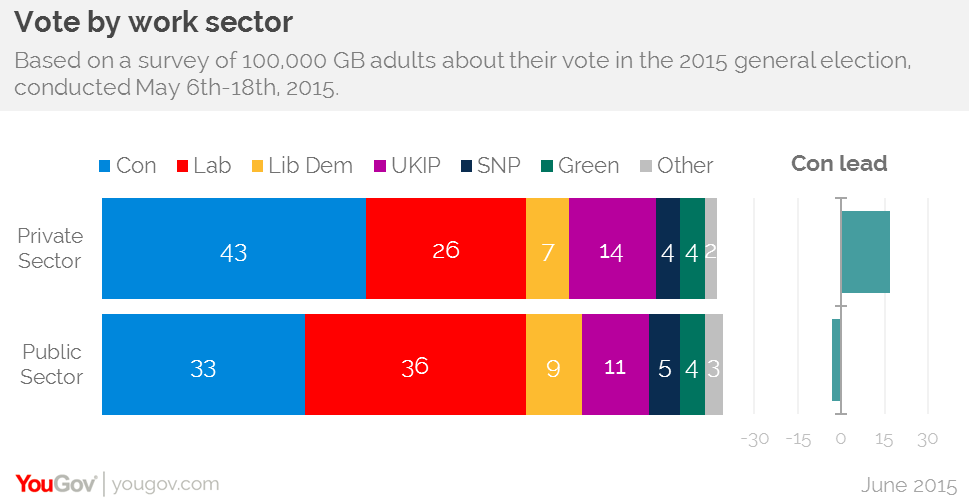
PUBLIC AND PRIVATE
There is a growing divergence between private and public sector workers. The Tories led Labour by 17 points among people working in the private sector, while Labour lead by three points among public sector workers. That 20-point gulf between the two groups has widened from a 16-point gulf in 2010 (16-point Tory lead among private sector workers, level-pegging among public sector workers). If this gulf persists, it’s good long-term news for the Conservatives, as private sector employment expands while the public sector contracts.
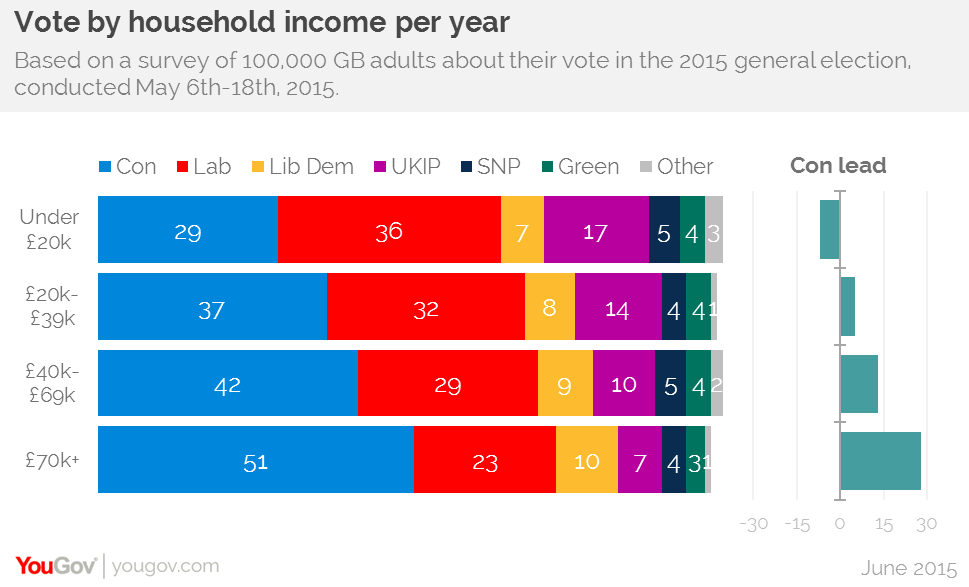
INCOME INEQUALITY
The rise in economic inequality is matched by voting trends. Among voters in households earning less than £20,000 a year, Labour’s lead widened from 3% in 2010 to 7% this year. While the Tories increased their leads by five points among the two highest-income groups: from 8% to 13% among those earning £40-69,000 a year, and from 23% to 28% among those earning more than £70,000 a year.
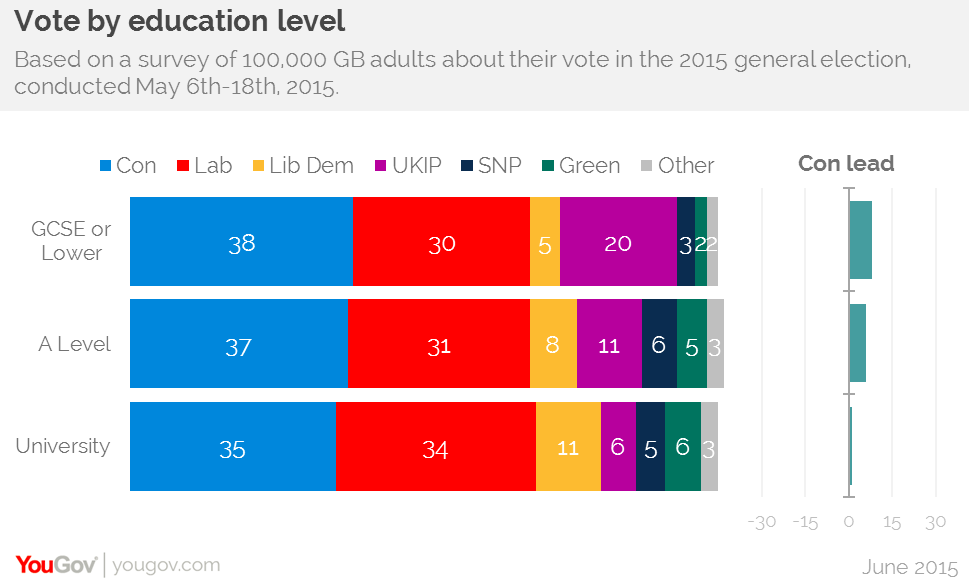
GRADUATES FOR CHANGE
As in the United States, university graduates are the most likely to vote for progressive parties. If we combine the votes for Labour, the Lib Dems, Greens, SNP and Plaid Cymru into a “left” total and Conservatives and Ukip into a “right” total, then graduates voted left 57%, right 41%. Among people with no qualifications, or GCSE at most, the division was: left 40%, right 58%. The in-betweeners educationally (with A-levels or equivalent as their highest qualification) were also in-betweeners politically: left 51%, right 48%.
ACROSS THE GREEN DIVIDE
The Greens and Ukip appealed to opposite groups. Ukip’s strongest support came from readers of the Express (27%) and Star (26%) and from people with no qualification beyond GCSE (20%). Green support for these groups was 1-2%. The Greens’ strongest groups were Guardian readers (14%), Independent readers (11%) and full-time students (9%). Ukip support among these groups was 1%, 4% and 6% respectively.
A version of this article was previously published in Prospect